

Five ways for kids to learn to love data
None of which require graphing software or a computer: just curiosity.

This Sunday is Mother’s Day in the United States. I had a lot of expectations of what parenting would look like, but didn’t predict the amount of joy I find in seeing my kids explore and make sense of the world through numbers.
I spend more time than most thinking about how to cultivate a curiosity data and answering questions with numbers for my kids, who are currently two and six years old. The seeds of being a good data communicator are sown early!
I’ve found data visualization is one of the best tools for getting kids to think more deeply about data, even if we’re not naming chart types or spinning up graphics in Tableau just yet. Obviously, charts can be colorful and fun, but they also connect with the ways our minds process information and see patterns before we even realize we’re seeing them.
In the spirit of sharing and hopefully reducing the mental load for any other moms out there hoping to raise data-curious kids, here are five ways you can help your little kids have fun with data and learn some data viz in the process.
1. Be curious and answer questions with data
My kids know that my job is ‘to make pictures with numbers.’ That’s much simpler to make sense of that saying I’m a ‘data visualization designer’. Our kids don’t need jargon: they need curiosity.
I see opportunities to be curious and ask questions that we can answer with data just about everywhere, including with the objects we already have around our house. You could:
Sort a bin of LEGO by color and stack them to see which tower is biggest.
Separate the Halloween candy into chocolate and non-chocolate and count the pieces, comparing which number is larger (count) or which pile looks bigger (volume).
Track how tall a kid is each month and talk about about how much they’ve grown (change over time).
We don’t need to overcomplicate things. Instead, we can model that curiosity and start sharing the questions we’re answering with data with our kids.
2. Read books that celebrate data visualization
While there are many great longer books that teach data visualization principles (like Drawing Data for Kids) well suited for older kids, I have two favorites for the littles who still love lots of pictures.
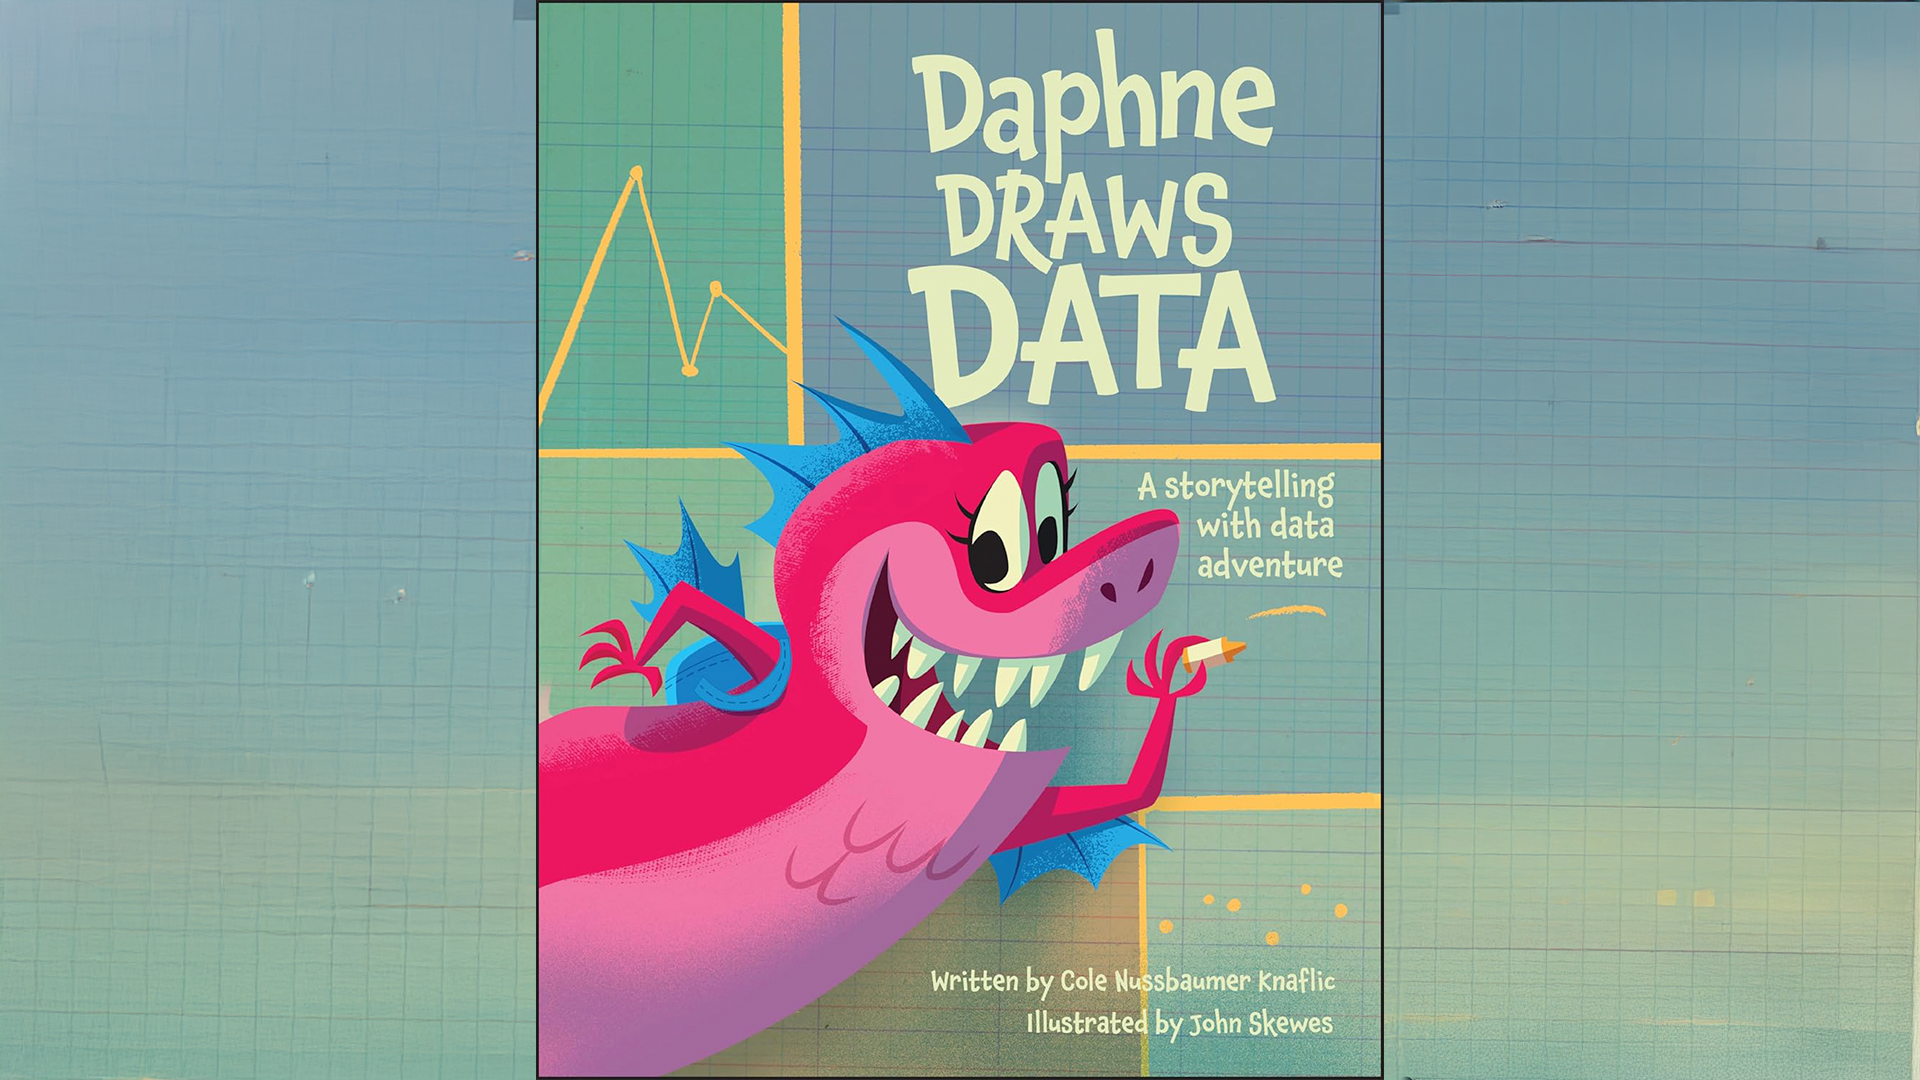
Daphne Draws Data by Cole Nussbaumer Knaflic (author of Storytelling with Data, all about data viz and communication for grownups) is a delightful, colorful romp through the world of Daphne, the data drawing dragon, whose brother doesn’t think that you can really draw data. From banana trees to outerspace, Daphne shows little readers how you can answer questions with data.
While the book has a lovely, illustrated guide to charts at the end, the real joy is that this is a beautiful kids book, which happens to encourage data curiosity in the process. Daphne isn’t just making charts at random; she’s using them to test hypotheses and solve problems. Both of my kids love this book, and we were lucky enough to have Cole do a reading and graphing activity at my son’s school!
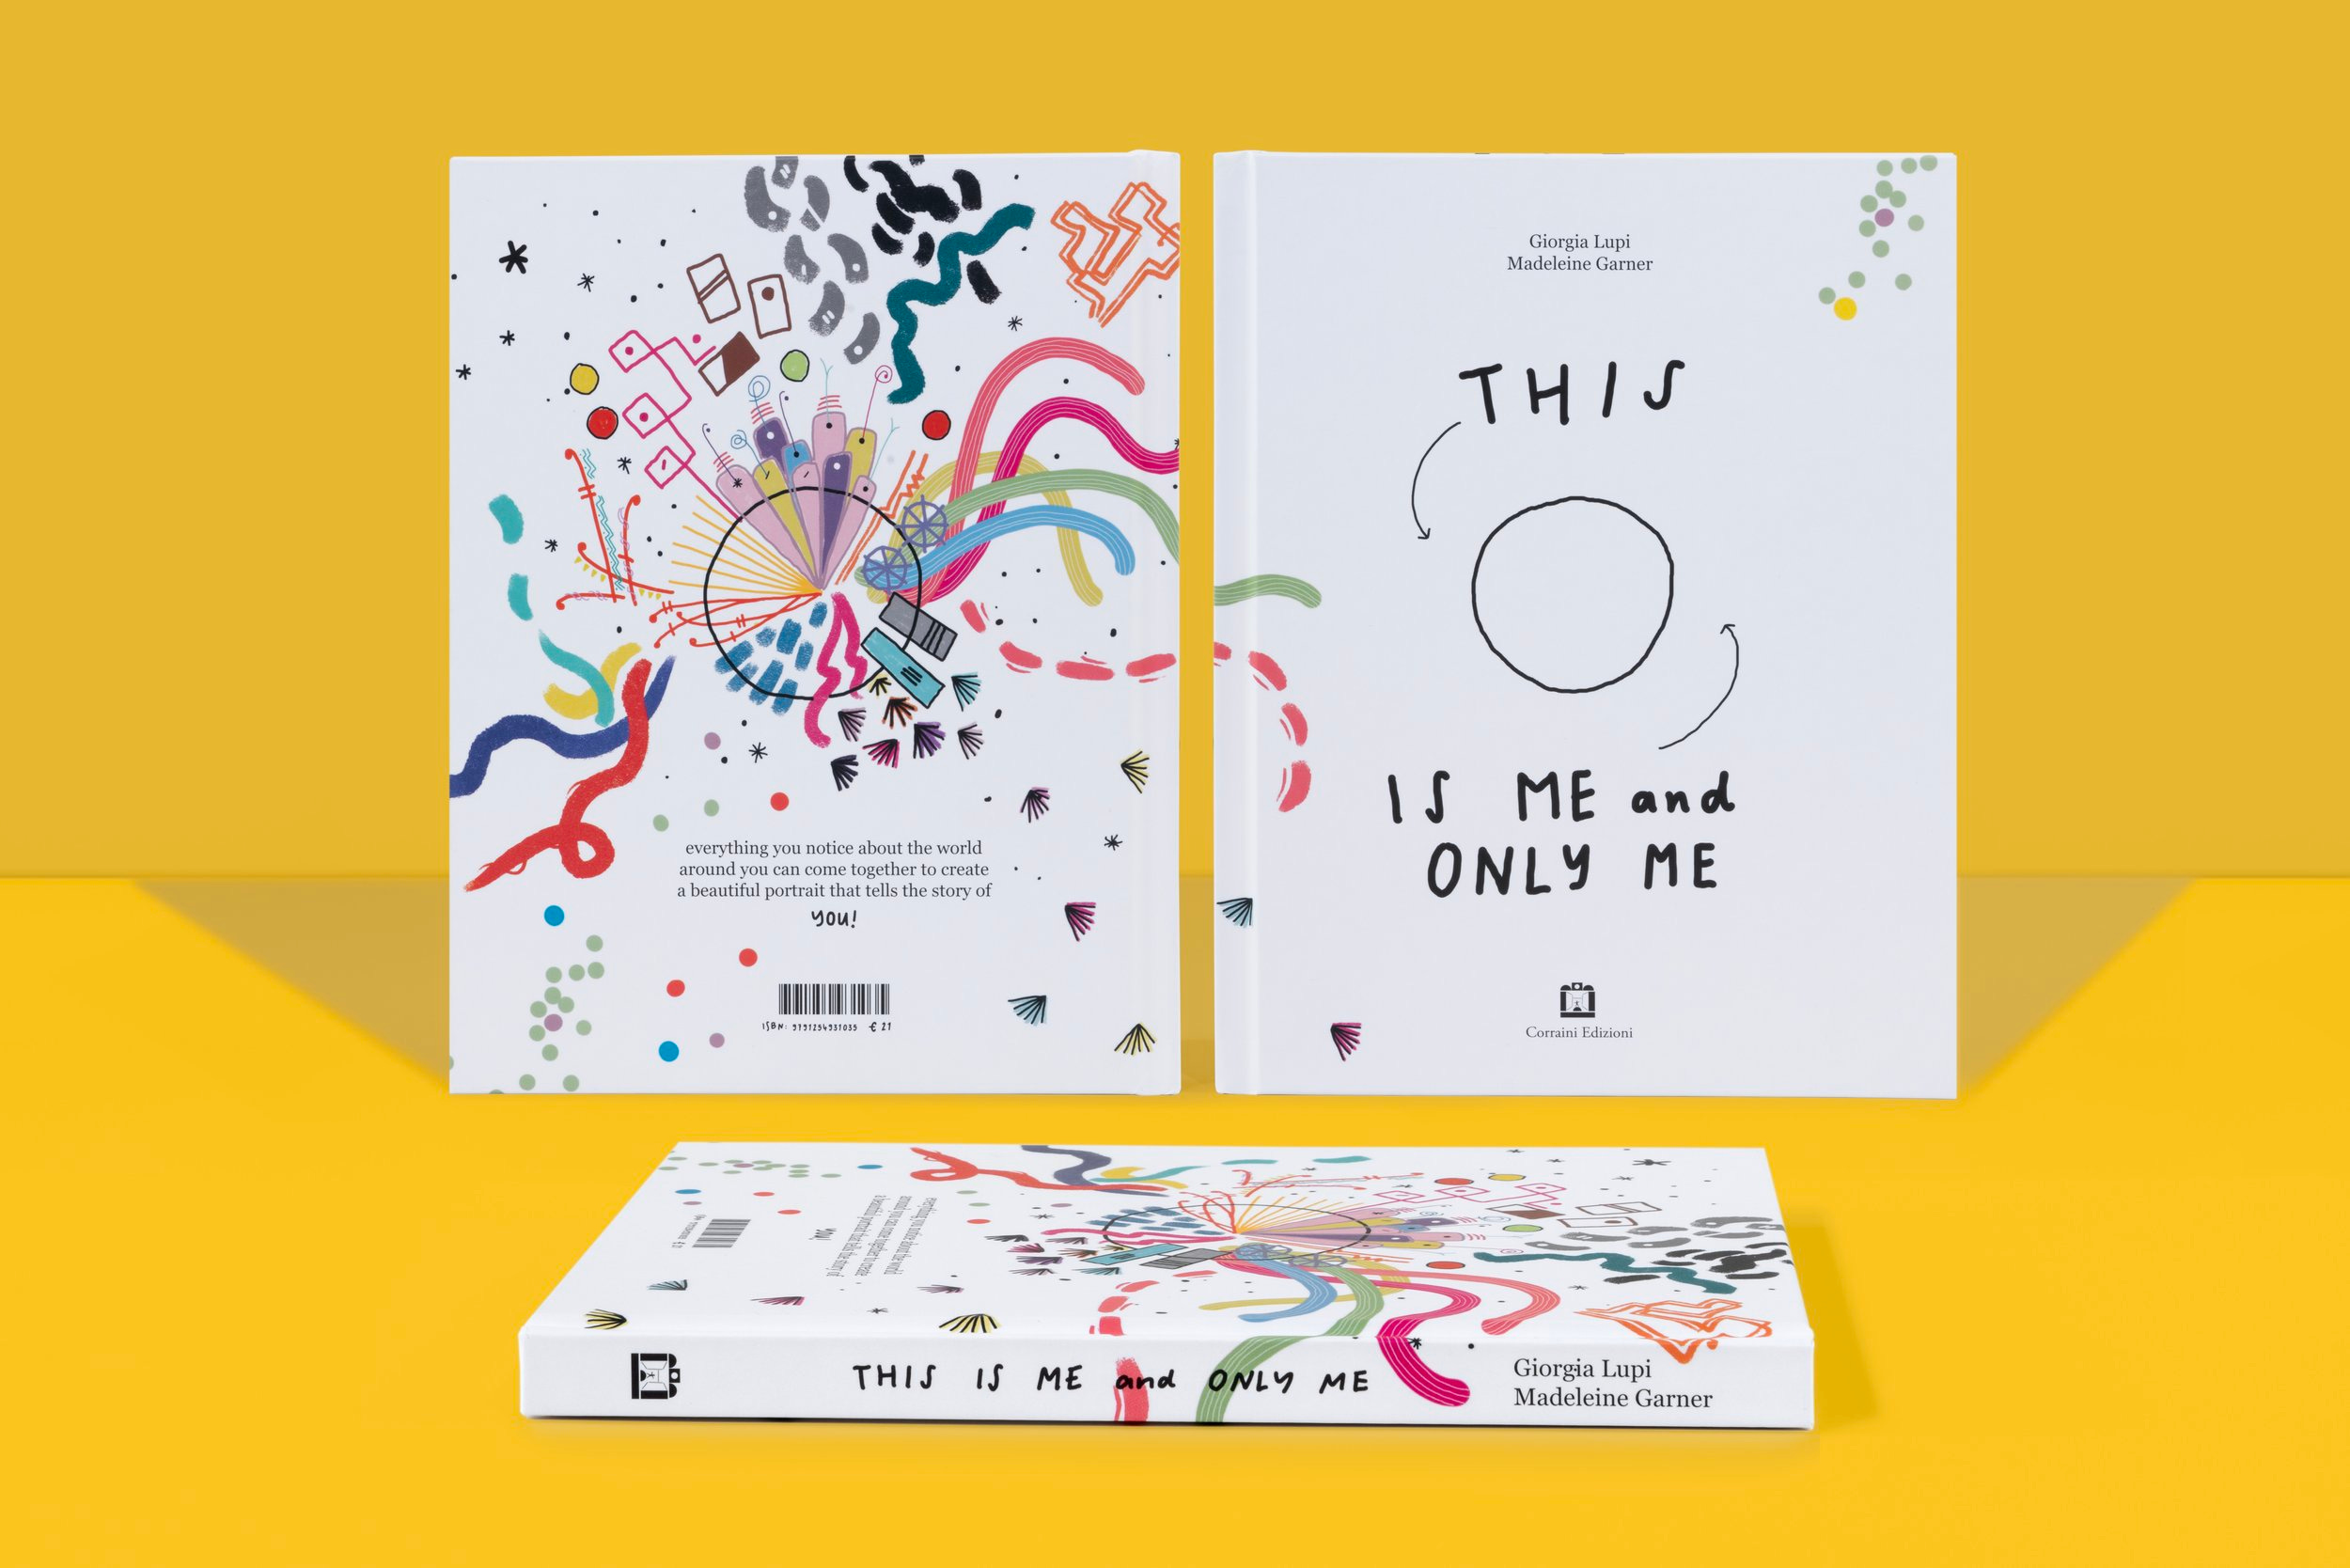
This is Me and Only Me by Giorgia Luipi and Madeline Garner invites young readers to explore how ideas, actions, and feelings can be drawn with shape, color, position, and other encodings. The book has ample white space across the pages, where readers can draw their own iterations on the ideas, and brings concepts from the Dear Data project into a more accessible format for young ones.
All of that might sound complicated for a kids book, but it’s a beautiful way to start a kid with thinking in the language of encodings (ways to represent information) rather than the language of chart types, which can be more constraining. I’d suggest this one for first grade and up.
3. Collect and create with data to answer questions
When I teach workshops to adult learners, my suitcase might look more like I’m teaching a kids art class: post it notes, graph paper, Sharpies of all colors, pens, play doh, LEGO, sometime other random found objects…I’m all for bringing creativity and fun to rewire how we think about data and get off of the computer screen.
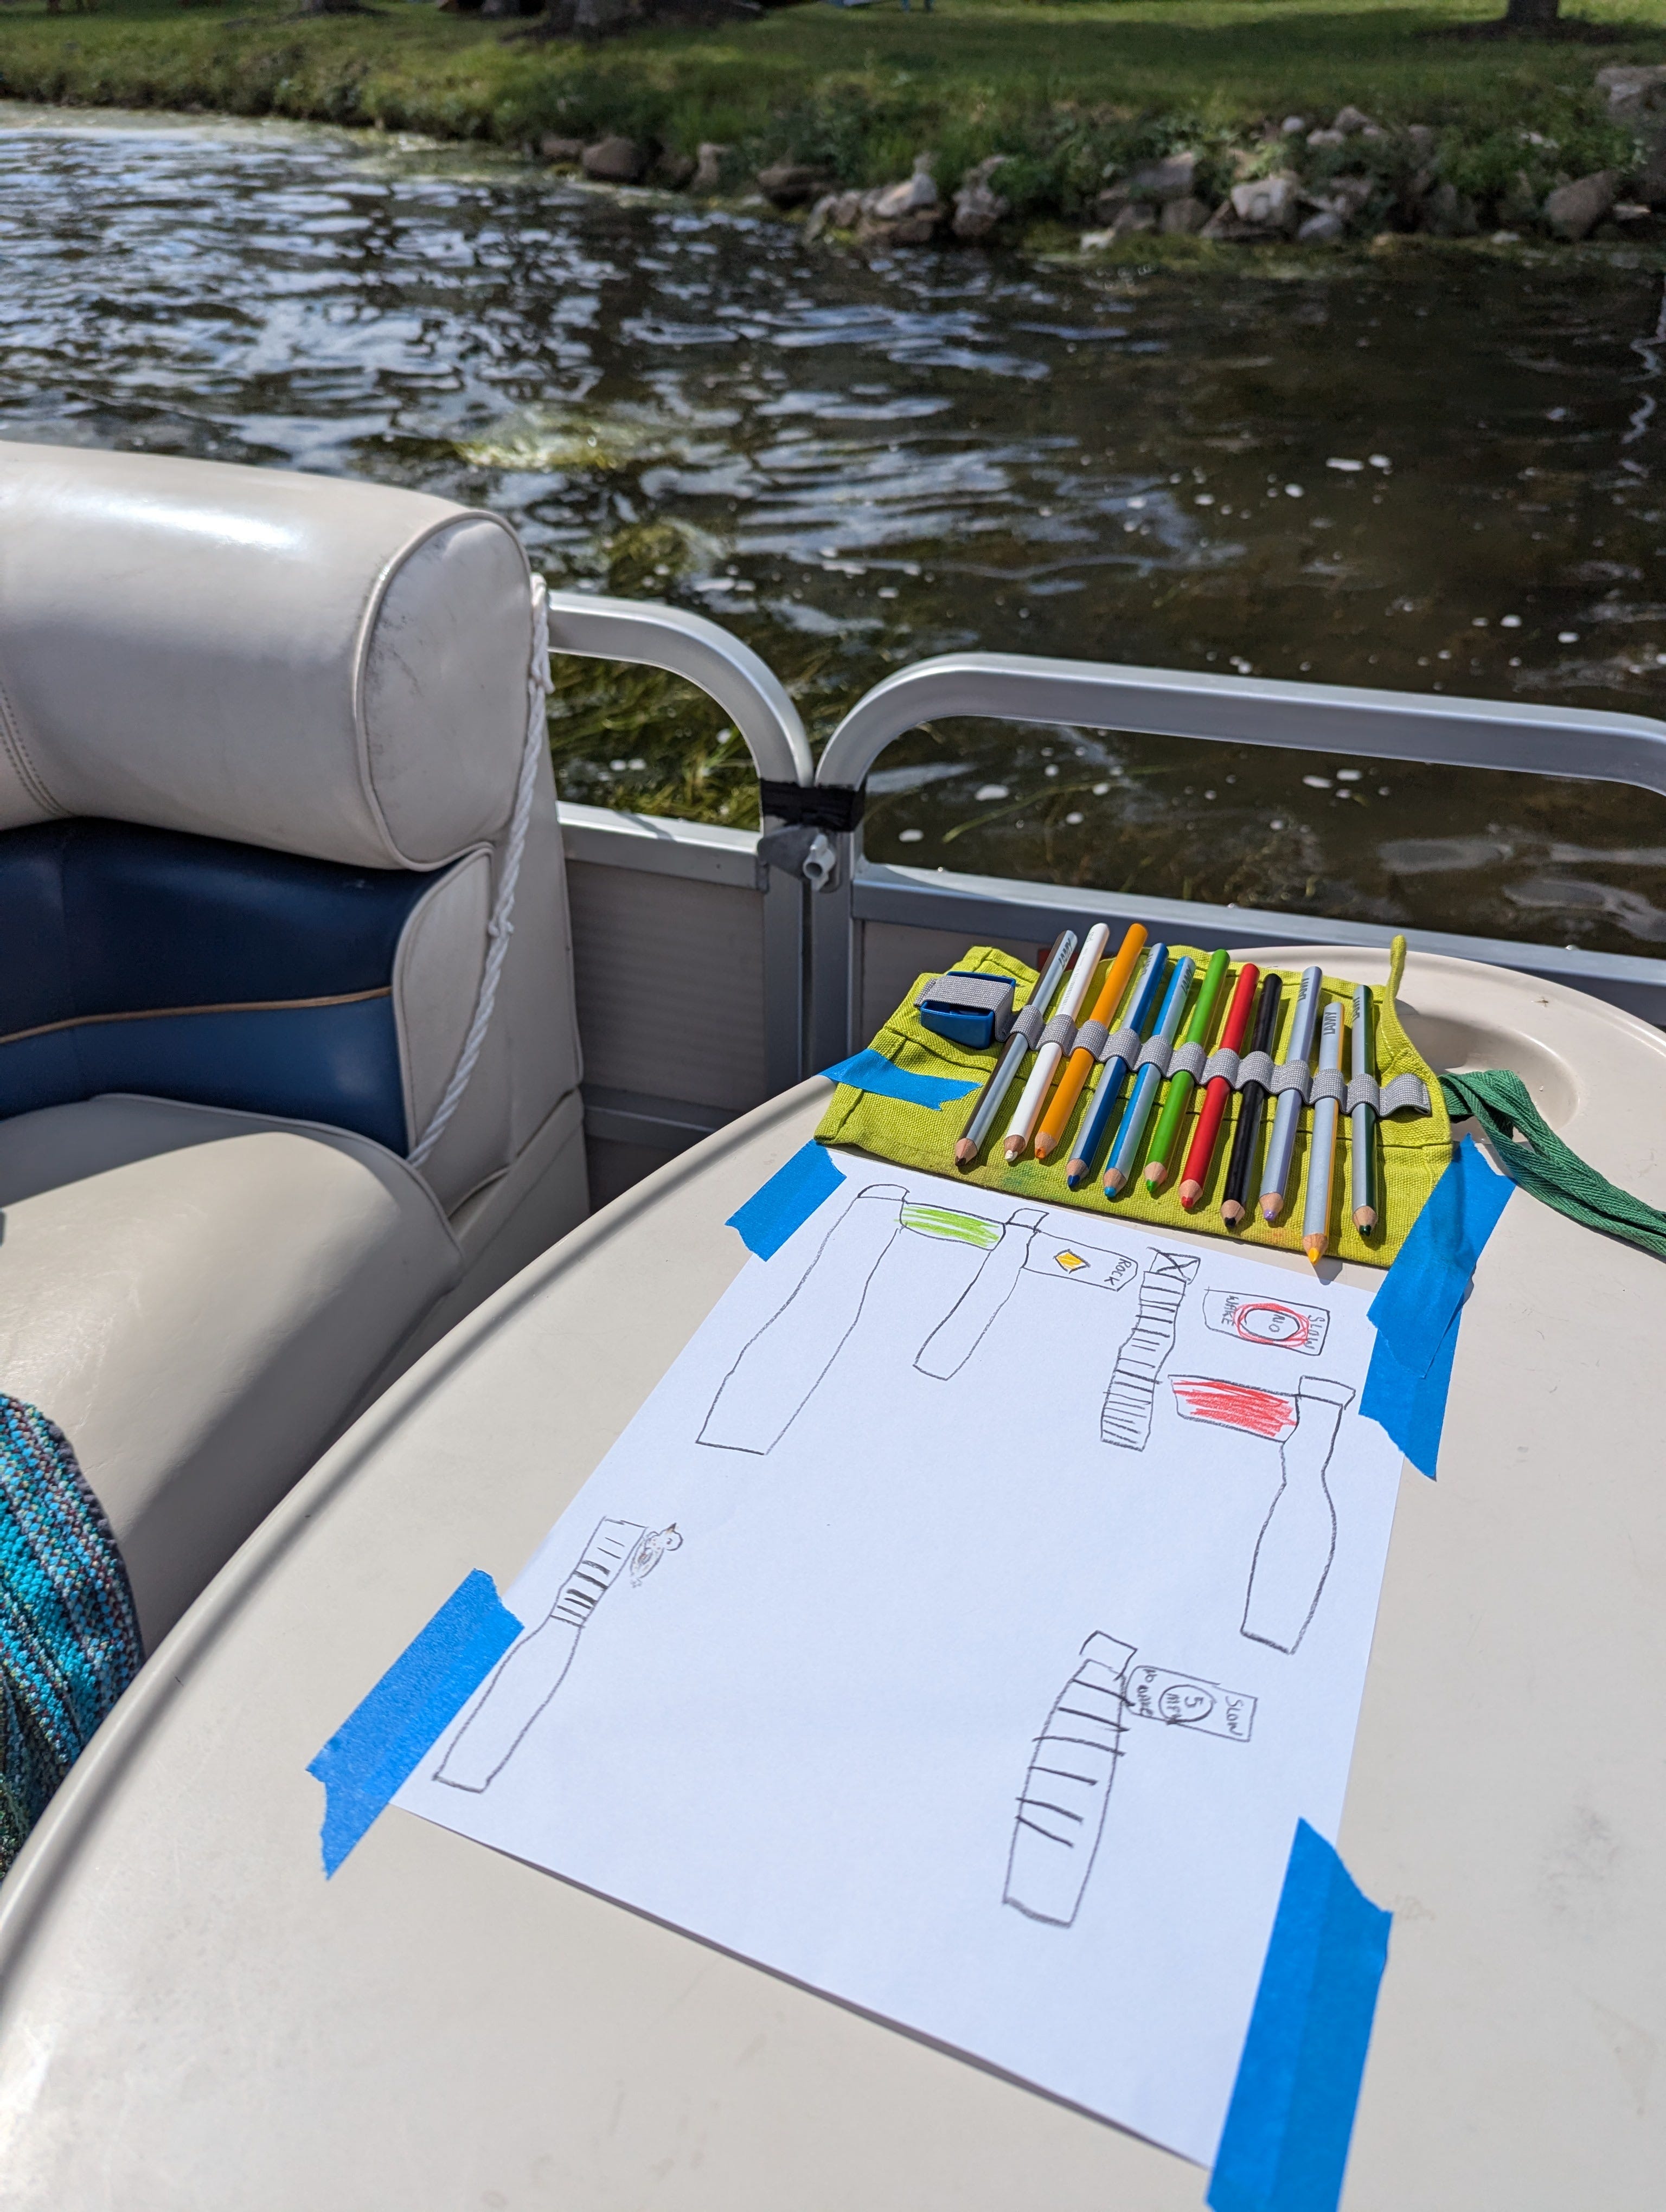
Last year we were at the lake and my son was obsessed with identifying and counting buoys. We also enjoyed some slow cruising around the lake, which could get a bit tedious for the kids (though did result in some great naps). Before we headed out one day, I asked which type of buoy he thought was the most common, which led to this tracker where he tallied each one he saw.
I love the drawings he created with the colors and shapes for the buoys, which made for another fun conversation around different ways we could tell buoys apart even if we couldn’t read the text in the distance. What I love about this is that the result can be a chart, but he’s also learning how to collect data.
Recognizing that buoys aren’t a topic of conversation for most little kids, set up a question that piques your little’s curiosity. Consider common logical questions like:
Which are the biggest and the smallest? (Compare counts, weights, lengths)
Which category has the most? (Compare counts of items or incidents)
How long does something take? (Track and log time)
Then, find a creative way to capture the information. Maybe that’s a tracker, like our buoy counter, or a more physical way to collect information like stacking LEGO or collecting leaves in the garden and grouping by shape or color.
I’d highly recommend two things if you’re doing this kind of exercise outdoors or in another moving environment (like a car or boat): 1) use paint tape to anchor down the tracking sheet and 2) have pencils or markers that are in some kind of secured bag to avoid having them roll everywhere and result in a meltdown.
If you’re a parent with a small child, you know that’s when disaster can ensue, especially if you’re not within reach to help.
4. Experience data in creative ways
Museums are incredible places to find creative ways to engage with data. Some have dedicated sections on STEM and data, like the National Children’s Museum in Washington, DC, while others use data visualization as a tool for communicating information that even an early reader can engage with.

When we’re at an exhibit that has some kind of data component, I ask my kids about what they see (sometimes with zero interest or response back on their part, but at least I tried!) and nudge them to engage with any interactive ways to be part of plotting data.
The Feelings Cloud in D.C. (below) is a great example of using different colors of string to represent three emotions and then wrapping a string around pegs labeled with things like ‘ice cream’ and ‘bad dreams’ where the item corresponds with the feeling.
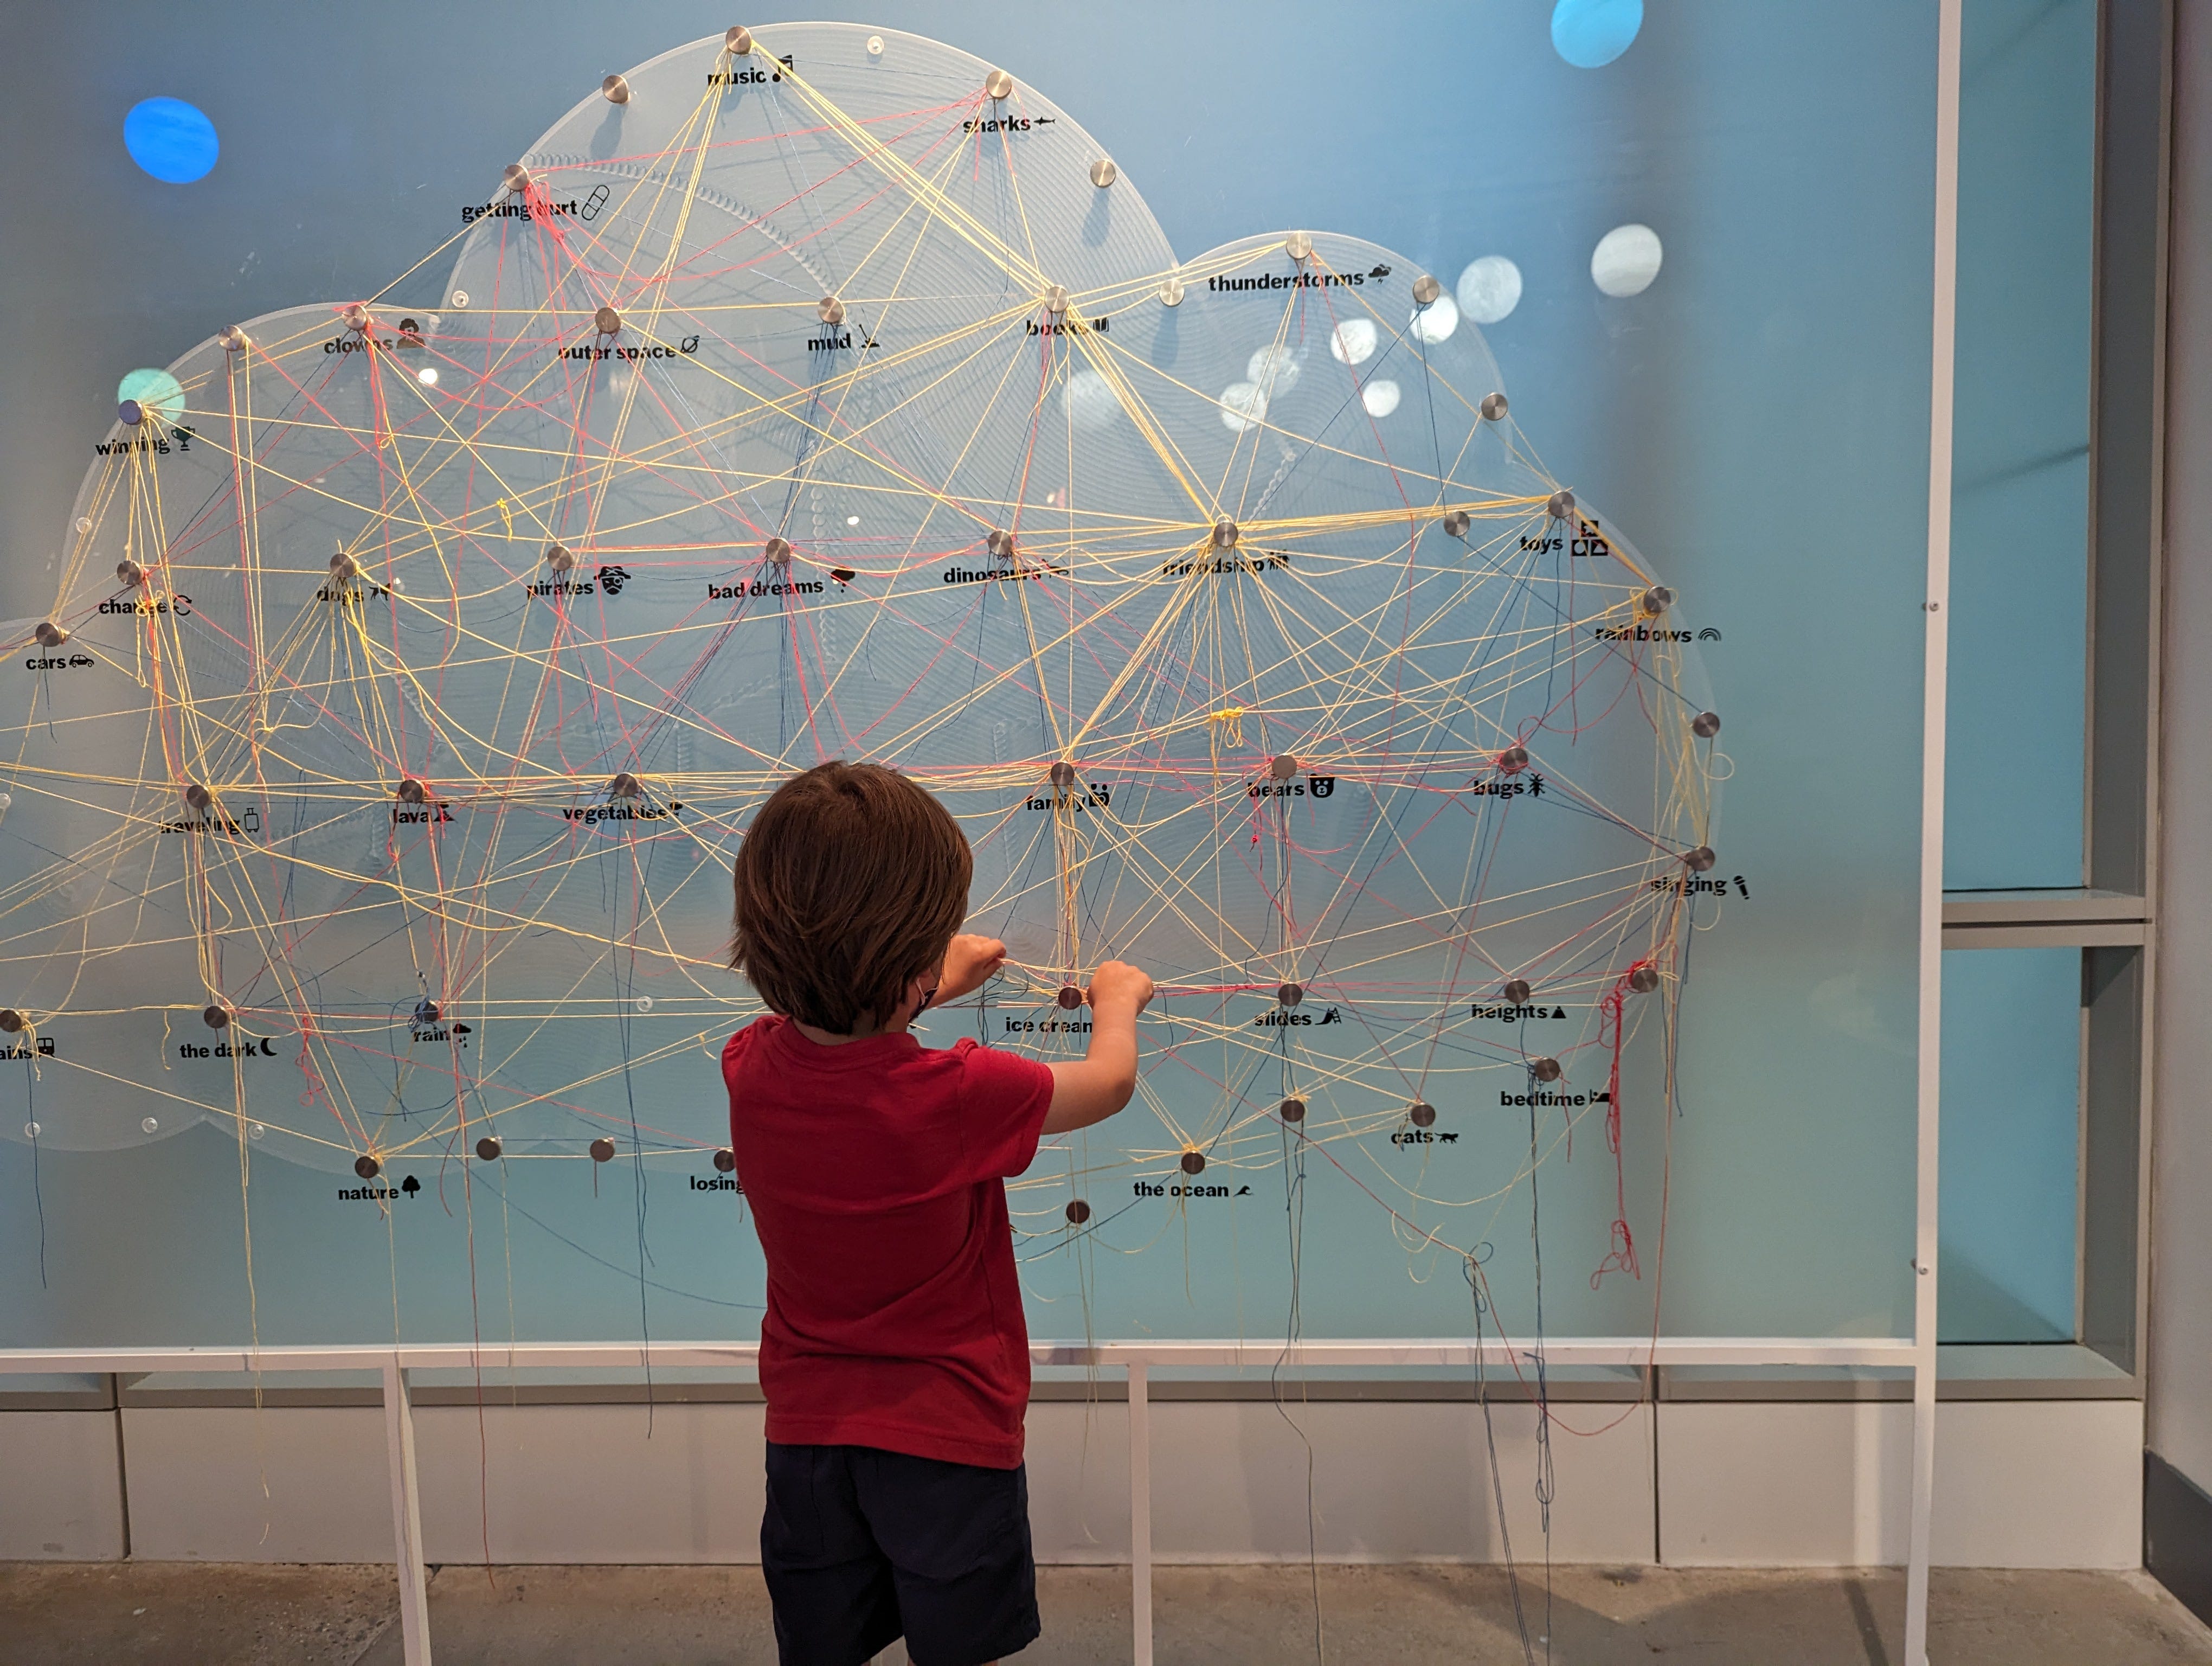
Is it precise? Absolutely not. But the goal is curiosity, not decision making.
What do we see when we look at the ‘nodes’ across the cloud? Lots of red strings around ‘getting hurt’ (upper left) and yellow around ‘friendship’ (middle right). Talk about the patterns that you see in these kinds of exhibit and ask your kids what they think. Is that how they see themselves and the world? What’s different about their experience?
5. Watch Numberblocks.
I’m sure there are other great STEM shows out there, but this list is all about what I’ve actually used in practice.
Our kids adore the Numberblocks, a BBC show where numbers are the characters and each episode is about math and patterns. For us, screentime as a tool; if it’s not something you or the littles in your life use, feel free to scroll on by this suggestion. For me, finding shows that my kids enjoy and learn from is always a win.
In Numberblocks, each number has a personality and a number of blocks equal to the number, making the math very visible. As a data viz nerd, I love the consistent use of color, shape, and block count to represent different numbers and the attention to details, like ‘3’ having three buttons and a three pointed crown and ‘5’ having a single five pointed star around one eye and giving ‘high fives.’

You can find the first season on Netflix and Amazon Prime, which introduces each number up to 20. Or, watch on their dedicated YouTubeKids channel. There are different levels to the show, so you can find everything from basic counting to complex multiplication and division.
Beware just how beloved these numbers can become. Our daughter insisted on a ‘Number 2’ theme for her birthday and our son picked Numberblock 56 for his Halloween costume. Both required quite the creative construction on my part, particularly building the wearable costume in a way that was comfortable for a 5 year old for trick or treating and for sitting down in his classroom at their Halloween party.

Over the top? Absolutely. But when your child wants to be a number for Halloween and you’re a data viz designer for your job, you say yes, because I really do believe that this young age is where a curiosity about numbers is born.
If you’re a mom, happy mother’s day. As Coco’s mom, Bella, says to Chilli in the episode Baby Race: you’re doing great.
For all of the other dads, grandparents, aunties, uncles, and friends who want to help the littles in their lives be more data curious, I hope this is a helpful list. I’d love to know what ways you help them learn to love numbers!
Sharing is caring ! Send this along to someone else who want to share the love of data with the littles in their lives.